Description: Data analysis for Meki Group - a coffee business chain headquartered in the US and many branches around the world. You will be provided by the company with raw data sets in .csv format about sales history and other information such as stores, customer information, employees and products the company is selling. Your mission is to use analytical skills and thinking to help Meki Group answer questions surrounding the company’s business activities as well as make reasonable suggestions for Meki Group to have the best results. timely and accurate decisions.
PowerBI - Dashboard:
Data Modeling:
- From 3 sales revenue data tables from 2020-2022, I have combined them into one large table to perform data modeling in Power BI as follows:

Sales Overview 6months:
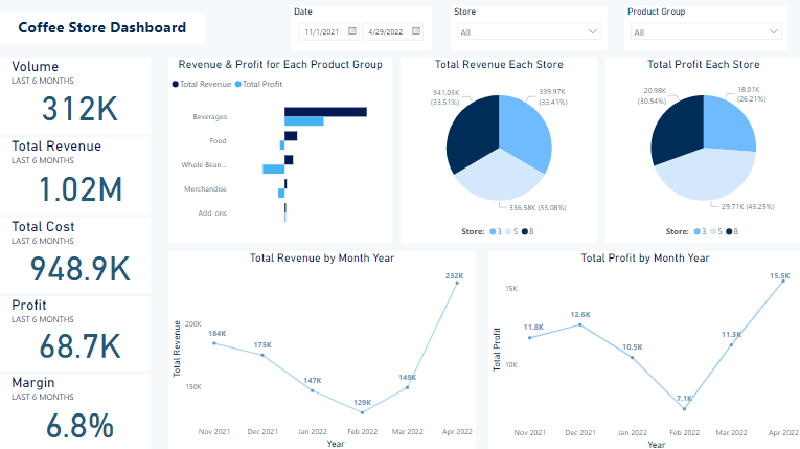
Question: Mr. Brewer Mark - CFO of Meki Group needs you to provide him with an overview of Meki Group’s business situation in the last 6 months.
By performing transforms and calculations, I have built a dashboard to monitor the business situation through revenue, cost, profit and profit margin indicators of Meki Group in general and each store in particular.
The snapshot for the console is as follows:

Customer:
Mr. LeBean Jean - CEO of Meki Group wants to better understand the company’s customer base (for example: average age, gender, etc.).
Regarding the company’s customers, I focus on analyzing data on demographics and transaction behavior for the store.
The snapshot for the console is as follows:

Insights:
- During the period from 1 - 5am, only a few customers came to transact a large number of products. This is the store’s distributor.
- Customers aged 20-50 and women make up the majority at the store. They tend to come more in the morning.
Employee Commision:
Help Meki Group calculate the total revenue and average revenue of each employee in Q1 2021 thereby comparing this number with Q1 2022.
Suppose each employee will be rewarded with 5% commission on revenue, how much commission does each employee receive? The person with the highest commission in each quarter above contributes what % of sales to Meki’s entire revenue?
I have built a quarterly revenue report for 2021 and 2022 for each employee in the company.
We can easily track the revenue each employee brings along with the % of that person’s contribution. The commission table will also be used to calculate 5% of the revenue the employee brings.
It will look like the following:

Product:
Finally, I built a dashboard to track revenue and profits of products sold as follows:

SQL - RFM Analysis: Customer Segmentation
In marketing, sometimes we need to group customers to use many campaigns. This helps boost the profit of company. To do this, I will use RFM Analyst by SQL for Customer Segmentation.
RFM stands for Retency - Frequency - Monetary. Based on the above three factors, the customer portrait will be portrayed for appropriate promotion.
I wrote a SQL script based on store transactions from 3 tables 2020-2022. The code will divide customers into the following groups:
- Loyal
- Promising
- Big Spenders
- New Customers
- Potential Churn
- Lost
SQL Script:
WITH rfm_cal AS (SELECT
  customer_id
  ,DATE_DIFF((SELECT MAX(transaction_date) FROM sales), MAX(transaction_date), DAY)  AS Recency
  ,COUNT(DISTINCT transaction_id) Frequency
  ,ROUND(SUM(quantity_sold*unit_price),2) Monetary
FROM `valued-plane-361602.study.sales`
GROUP BY 1
)

,rfm_score AS(SELECT *
  ,NTILE(4) OVER(ORDER BY Recency DESC) R_Score
  ,NTILE(4) OVER(ORDER BY Frequency ASC) F_Score
  ,NTILE(4) OVER(ORDER BY Monetary ASC) M_Score
FROM rfm_cal)

,rfm_table AS (
SELECT *, CONCAT(R_Score, F_Score, M_Score) RFM_Score
FROM rfm_score)

SELECT
    customer_id
    ,CASE
        WHEN REGEXP_CONTAINS(RFM_Score, r'^[3-4][3-4][3-4]$') THEN 'Loyal'
        WHEN REGEXP_CONTAINS(RFM_Score, r'^[3-4][3-4][1-2]$') THEN 'Promising'
        WHEN REGEXP_CONTAINS(RFM_Score, r'^[3-4][1-2]4$') THEN 'Big Spenders'
        WHEN REGEXP_CONTAINS(RFM_Score, r'^[3-4][1-2].$') THEN 'New Customers'
        WHEN REGEXP_CONTAINS(RFM_Score, r'^2..$') THEN 'Potential Churn'
        WHEN REGEXP_CONTAINS(RFM_Score, r'^1..$') THEN 'Lost'
    END AS Segmentation
FROM rfm_table;
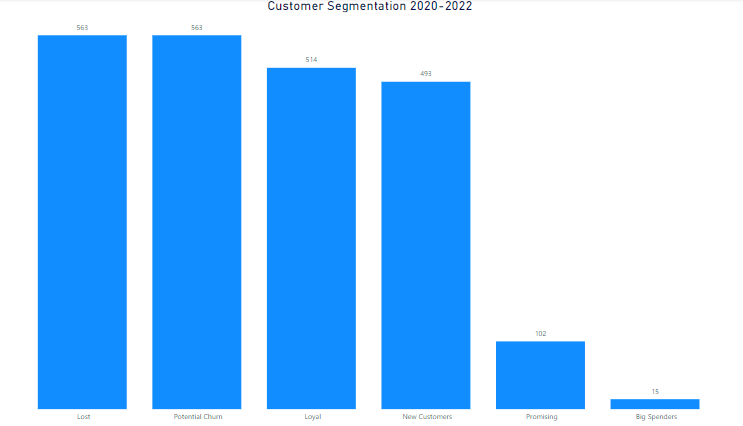
After that, we will have the following customer segmentation:

Looking at the chart above, we can see that although there are many new and loyal customers, the store also has a file of customers at risk of leaving.
Although the furthest purchase date in the store’s transaction history is only about 1 month, it is because the store has a convenient geographical location and a frequent customer base. Therefore, businesses can implement discount campaigns combined with feedback to find out customer pain points.
Access my dashboard:
Check out the sketch at: Link
You can download the dashboard and take a look at my Github repo: Link

